Observability
It’s 2am and something’s slow. Ask what broke, and get the trace, not a guess.
Logs, traces, error groups, monitors, and your AI agents’ tool calls, in one place. Ask Smooth Operator what changed and it reads them for you, then shows you exactly where it looked.
- Logs, traces, errors, monitors
- AI tool failures included
- Read-only: it never touches prod
Ask what’s wrong. Get where it looked.
Smooth Operator checks service health, pulls the slowest traces, ranks the errors, and tells you what it couldn’t see.
Every answer links back to the rows. Open them and check.

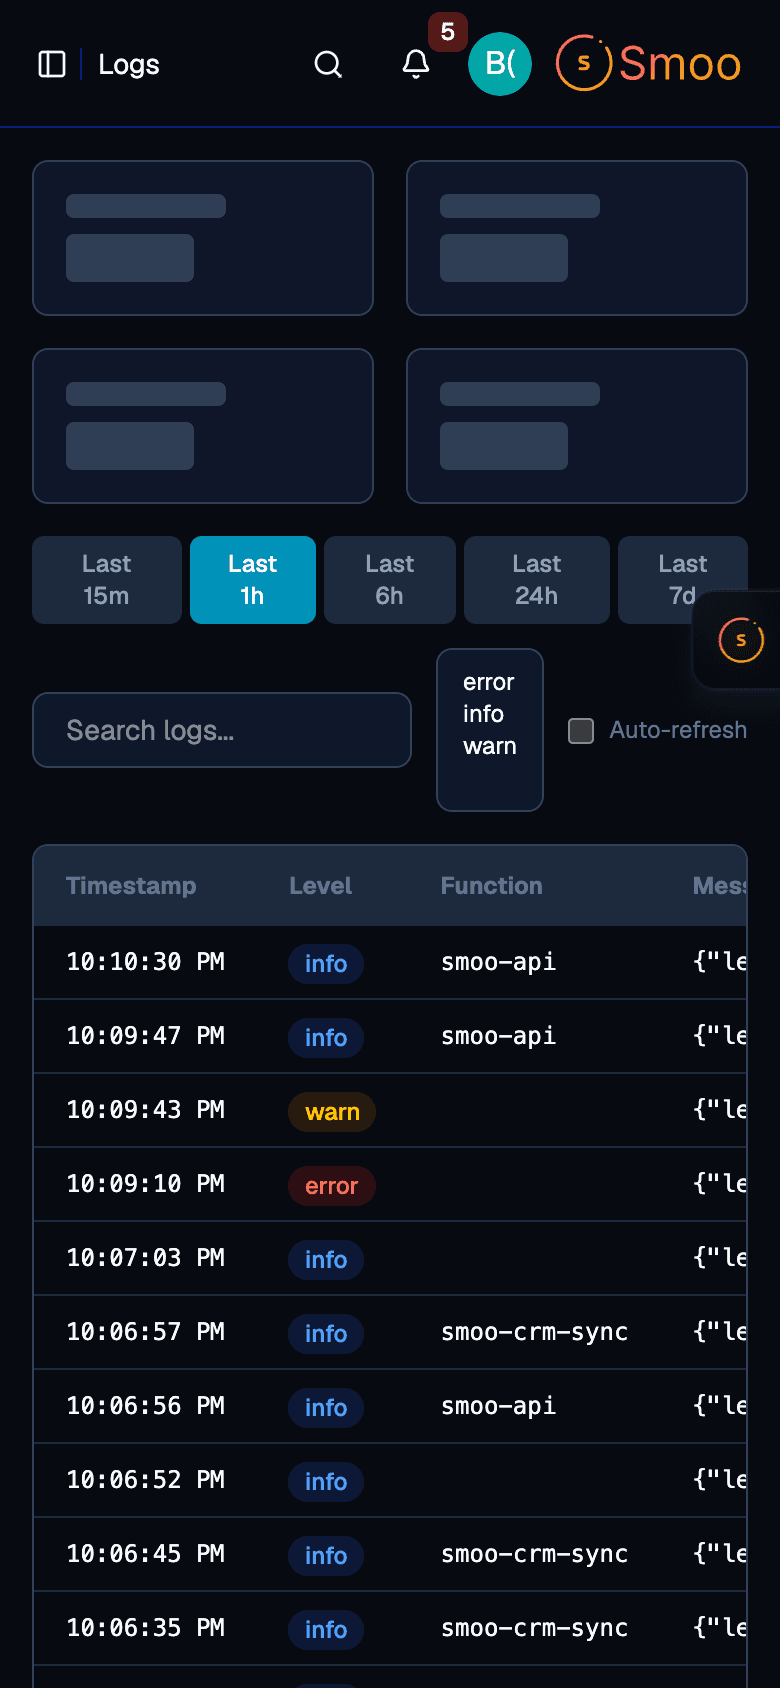

Where it looks
- Logs
- Full-text search by service, level, trace, or any field
- Traces
- Slowest first, filtered by service, operation, or duration
- Errors
- Grouped by fingerprint, with new ones called out
- Monitors
- Uptime, thresholds, and error groups, with no-data alerts
- AI turns
- Every agent turn, its tool calls, and the tokens it used
It does the digging. You make the call.
It reads. It never changes anything.
Every observability tool Smooth Operator has is read-only. It can find the problem and show you, and that’s where it stops.
It says when it couldn’t look.
A query that found nothing and a query that failed are different answers, worded differently. A broken pipe never reads as a quiet night.
It won’t round a gap down to zero.
When results are cut off, it says there may be more. When something isn’t measured, like dollar cost per AI turn, it says so instead of reporting nothing.
It sees what your role sees.
Without observability access on your role, it can’t read the telemetry for you either.
Every tool has an off switch.
An admin can turn any of them off for the whole organization.
- It reads, it never changes.
- It says when it couldn’t look.
- It never invents a number.
Fair questions
The questions people ask first. Straight answers.
Will this replace my team?
No. It does the first twenty minutes of every incident: which service, since when, which requests, which log lines. Your engineers start from the answer instead of a blank search box, and they still decide the fix.
What do I have to install?
Our open-source logger for TypeScript, Python, Rust, or Go, or any OpenTelemetry exporter you already run. Logs, traces, and errors land in the same place.
Does it watch our AI agents too?
Yes. Every agent turn, every tool call, and the tokens each one used. It can tell you which tool is failing and show you the conversation where it happened.
Can Smooth Operator restart a service or roll back a deploy?
No. Its observability tools only read. It tells you what it found and leaves the change to you.
What does it cost?
Observability is $39/mo. We run our own platform on it, so the tools on this page are the ones we use when something breaks.
How is this different from the monitoring tools we already have?
Those show you dashboards and wait for you to dig. Here you ask what broke, in plain words, and Smooth Operator reads the logs, traces, and errors for you, next to the rest of your business. ChatGPT helps you think. Smooth Operator does the work, inside your business.
Connect one service. Ask about it tonight.
Observability is $39/mo. Add the logger or point your OpenTelemetry exporter at us, and the next time something’s slow, ask.
Rather talk it through first?
Tell us about your stack and the service you want to see first.
By submitting this form, you agree to our Privacy Policy and Terms of Service.